Two Parameter Model for Running Performance
Human running performance from real-world big data is a super cool paper from 2020 that analyzes 14,000 people’s running activities. They propose a formula that can predict race times from different distances based on two parameters: top-end speed and endurance.
Left: distribution of vm, or VO2max velocity in km/s. Right: E1, their index for endurance.
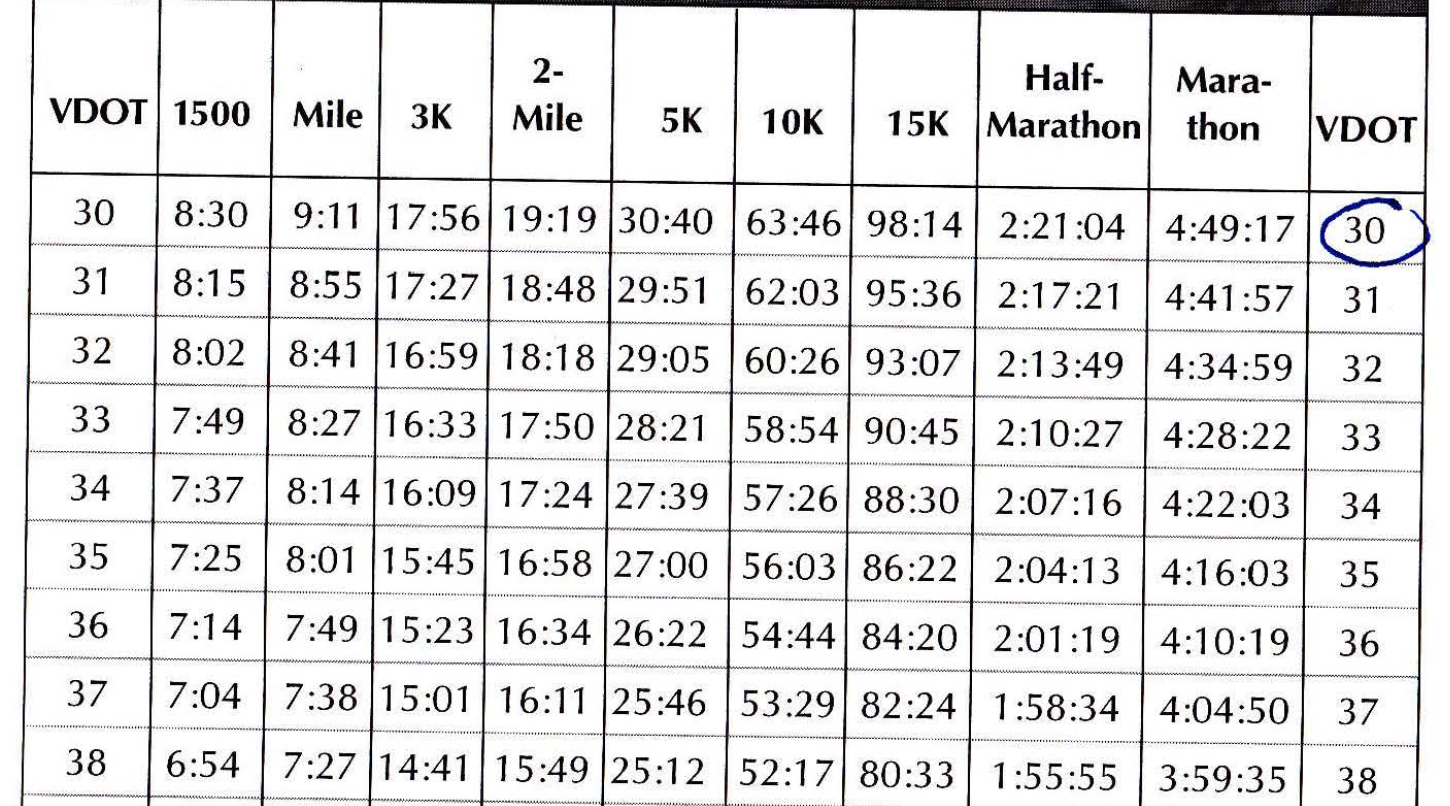
Comparison to Daniels' VDOT
This is a more nuanced approach than VDOT, which is a table of equivalent race times (5k, 10k, marathon) indexed by a single parameter: estimated VO2max, or “VDOT”.
The main issue with VDOT is that it’s common for casual runners to run much faster in shorter races than they could sustain for longer ones like a marathon. I personally ran a 20min 5k (VDOT ~ 50) and a 3:40 marathon (VDOT ~ 42), so these gaps can be really big, depending on the individual.
Race Pace Calculator
To make this formula more accessible, this page is a race pace calculator. If you provide race times you’ve run, it will predict your vm and E1 parameters with uncertainty, and list race time bands consistent with those parameters.
| Distance | Predicted Race Time | Recent Race Result |
|---|---|---|
| Mile | — | |
| 5k | — | |
| 10k | — | |
| Half Marathon | — | |
| Marathon | — |
The more data you can provide, the more accurately the statistical model can predict your vm and E1 values. At least two races of different distances are recommended (two unknowns needs two variables).
To make E1 more understandable, the authors calculate p1hU to be the fraction of your VO2max speed you can hold for an hour:
While any duration could be chosen here, we used 1h in analogy to running coaches defining threshold velocity as the effort that can be maintained for about 1h.
In this sample of trained runners, p1hU averages 82%, which exactly mimics a 1979 study. Based on your E1 and vm values, here’s your p1hU histogram: